Profiler
Profiler is the Module of UrbanDataLab that allows you to mancreate reports of assets. You can access Manager by clicking on the top bar item that symbolizes a table.

Selecting a report
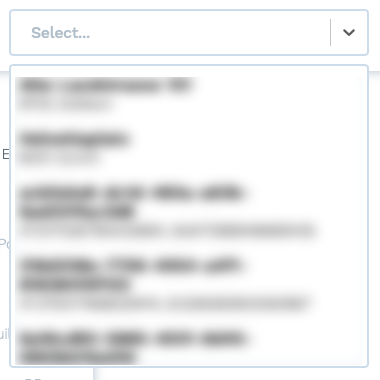
In order to be able to see a report, you must select one from the dropdown at the top of the page
Sections
The left menu has five buttons giving access to five different sections that allow to explore the reports:
Economy. Population, Building stock, Rental market and Buying market.

Economy
In the upper half, there are 3 different parts:
- Name of the property and its location
- Graphs of the Economy data around the object
- Key notes
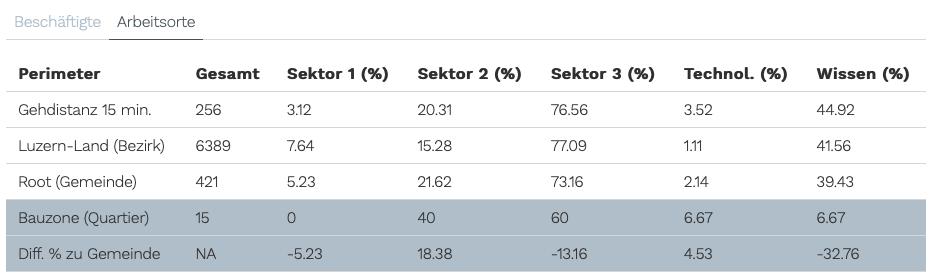
On this section, we can see 2 graphs related to Beschäftigte and Arbeitsorte. Those graphs show the temporal evolution of the data on the legend:
- Bauzone (Quartier)
- Commune (Gemeinde)
- Local region (Bezirk)
- Walking distance 15 minutes
- Public transport distance 15 minutes
- Motorized individual transport 15 minutes
Apart from the graph, the upper level has a space to add notes to the report. This can be edited using the pencil icon. Once finished, the save icon must be pressed to keep the changes.

In the lower half, the table has 2 different tab: Beschäftigte and Arbeitsorte

Population
In the upper half, there are 3 different parts:
- Name of the property and its location
- Graphs of the Population data around the object
- Key notes
On this section, we can see 1 graph related to population. This graph shows the temporal evolution of the data on the legend:
- Bauzone (Quartier)
- Commune (Gemeinde)
- Local region (Bezirk)
- Walking distance 15 minutes
- Public transport distance 15 minutes
- Motorized individual transport 15 minutes
Apart from the graph, the upper level has a space to add notes to the report. This can be edited using the pencil icon. Once finished, the save icon must be pressed to keep the changes.

In the lower half, the table has 3 different tabs: Haushalte, Personen and Segmente


Building stock
In the upper half, there are 3 different parts:
- Name of the property and its location
- Graphs of the building units data around the object
- Key notes
On this section, we can see 1 graph related to building units. This graph shows the temporal evolution of the data on the legend:
- Bauzone (Quartier)
- Commune (Gemeinde)
- Local region (Bezirk)
- Walking distance 15 minutes
- Public transport distance 15 minutes
- Motorized individual transport 15 minutes
Apart from the graph, the upper level has a space to add notes to the report. This can be edited using the pencil icon. Once finished, the save icon must be pressed to keep the changes.

In the lower half, the table has 3 different tabs: Buildings, Units and Segmente


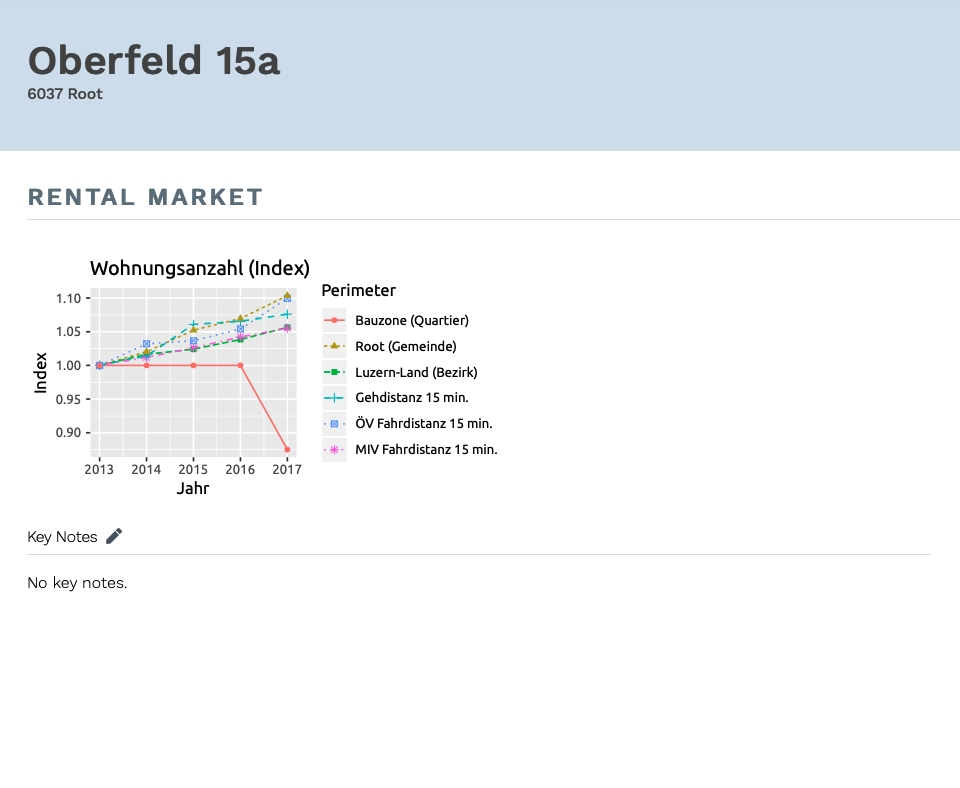
Rental market
In the upper half, there are 3 different parts:
- Name of the property and its location
- Graphs of the rental market data around the object
- Key notes
On this section, we can see 2 graphs related to market prices: rental in CHF per number of rooms and rental in CHF/m2 per number of rooms. These graph shows data at gemeinde level.
Apart from the graphs, the upper level has a space to add notes to the report. This can be edited using the pencil icon. Once finished, the save icon must be pressed to keep the changes.
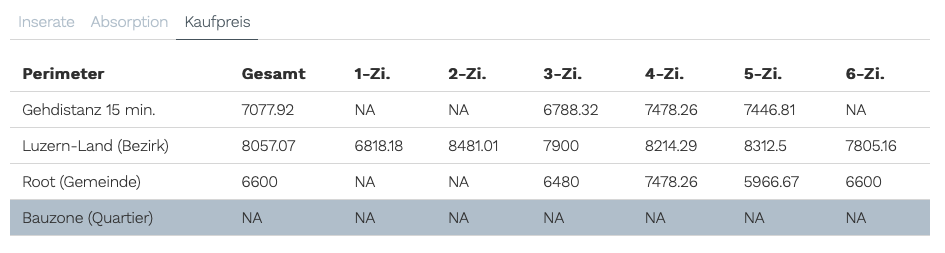
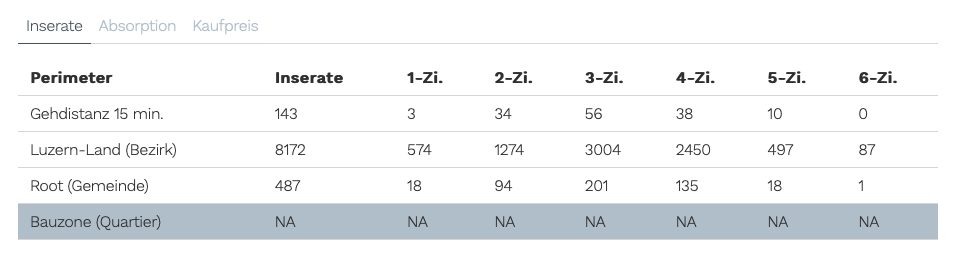
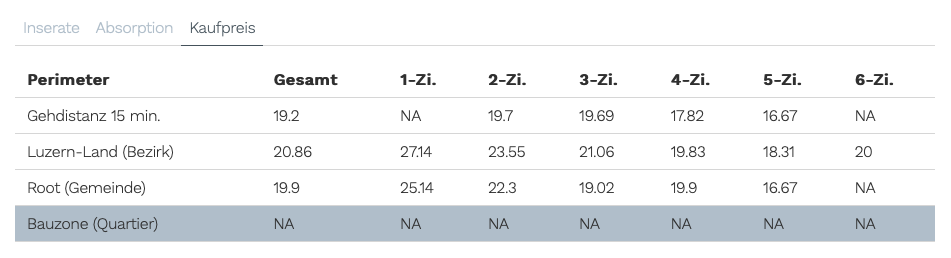
In the lower half, the table has 3 different tabs: Inserate, Absorption and Kaufpreis

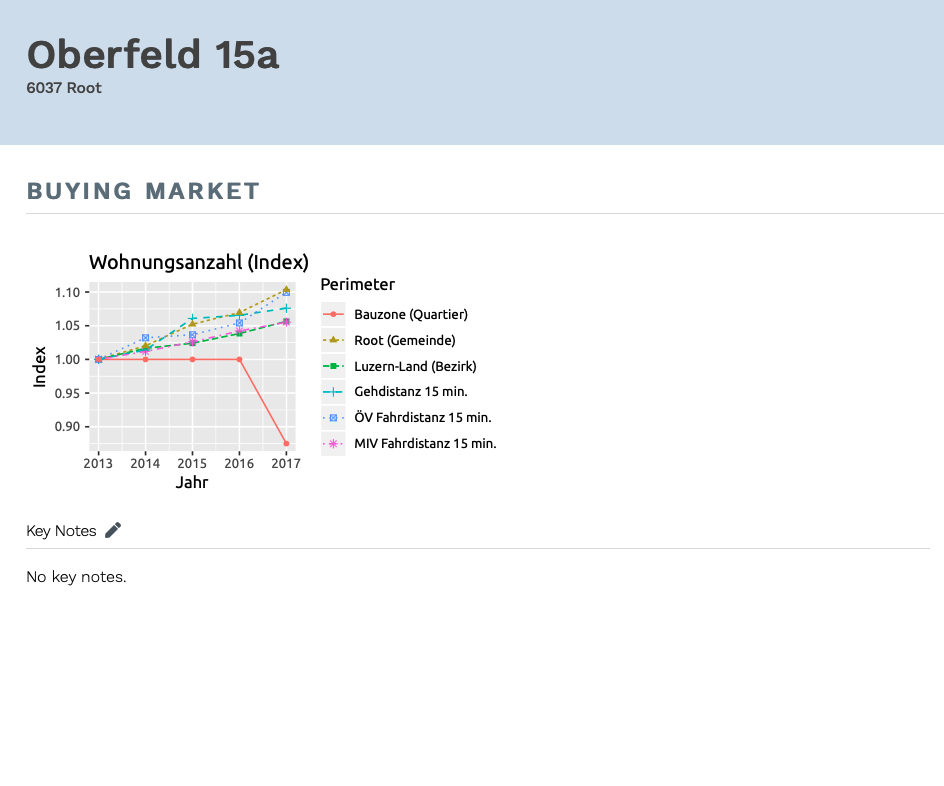
Buying market
In the upper half, there are 3 different part:
- Name of the property and its location
- Graphs of the Population data around the object
- Key notes
On this section, we can see 2 graphs related to market prices: buying in CHF per number of rooms and buying in CHF/m2 per number of rooms. These graph shows data at gemeinde level.
Apart from the graph, the upper level has a space to add notes to the report. This can be edited using the pencil icon. Once finished, the save icon must be pressed to keep the changes.
In the lower half, the table has 3 different tabs: Inserate, Absorption and Kaufpreis